How to plot bar graph in Python

In this article, we will be discussing how to plot a bar graph in Python. We are using the Matplotlib library for this.
Matplotlib is a visualization library in Python. We can use the following syntax in order to create a bar chart in Python using Matplotlib:
import matplotlib.pyplot as plt

plt.bar(xAxis,yAxis)
plt.title('title name')
plt.xlabel('xAxis name')
plt.ylabel('yAxis name')
plt.show()
You can install this library using the command,
pip install matplotlib
So we have installed the library now. We are taking the below dummy data for plotiing the bar graph.
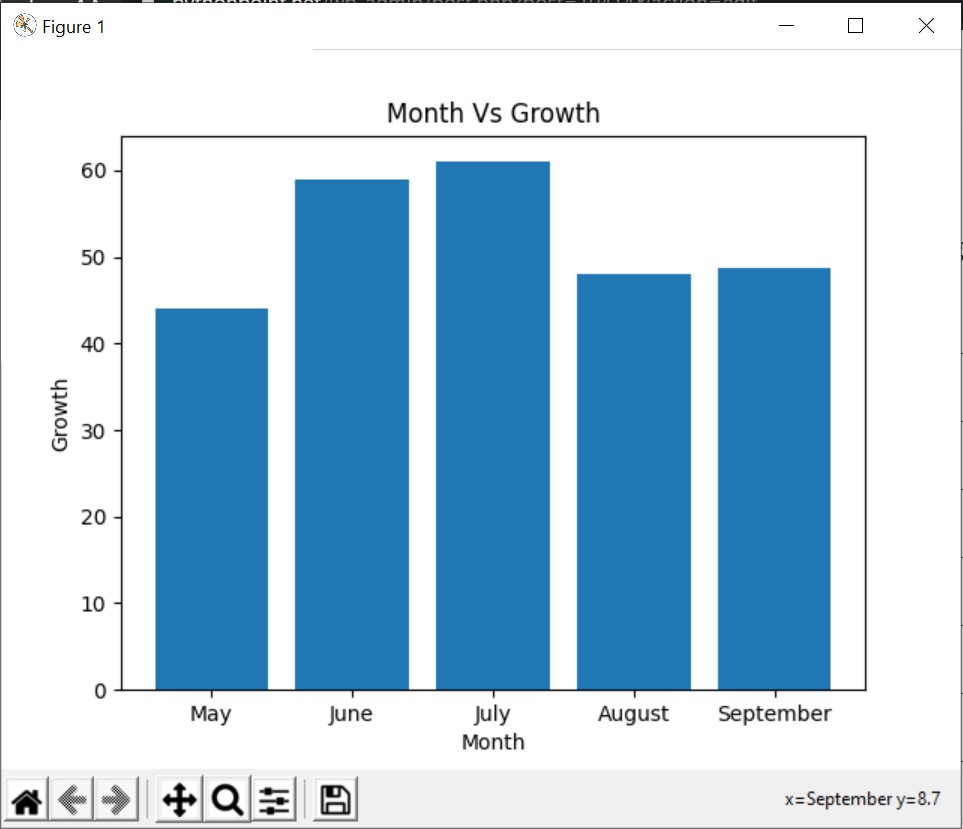
Below is the code for plotting the above data into a bar graph
import matplotlib.pyplot as plt

Month = ['May', 'June', 'July', 'August', 'September']
Growth = [44, 59, 61, 48, 48.8]

plt.bar(Month, Growth)
plt.title('Month Vs Growth')
plt.xlabel('Month')
plt.ylabel('Growth')
plt.show()
Output:

Subscribe
Login
Please login to comment
0 Discussion
